Color
What we will learn
Histogram
- Histogram is a graph showing the number of pixels used in the image for a given color or intensity.
- To view the Histogram go to Image > Histogram
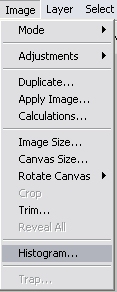
- The Histogram Screen will open up
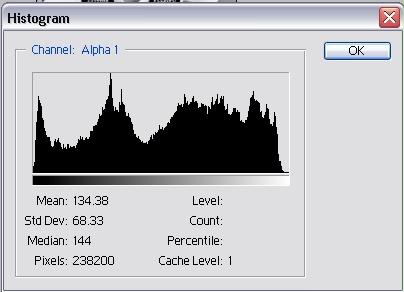
Image Modes and Channels
- Go to Image > Mode and you can select variety of mode from there
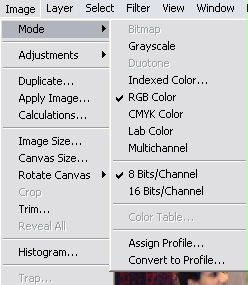
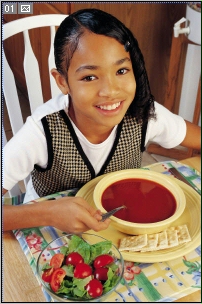
- Let us view this picture in different modes
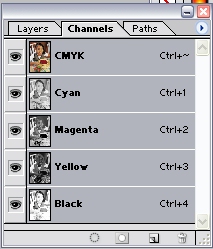
- Open up the Channels Palette and click the channel you want to view
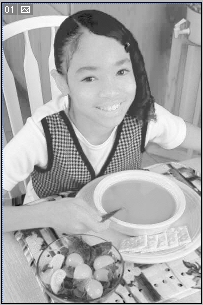
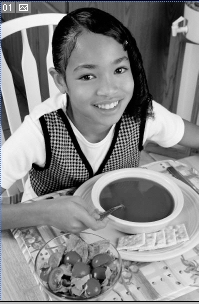
- RGB Mode: Pixels are recoded as a combination of red, green, blue color values
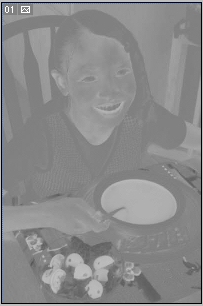
Red Channel
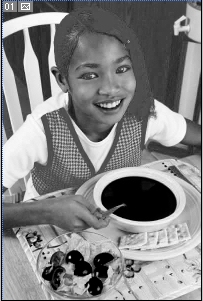
Green Channel
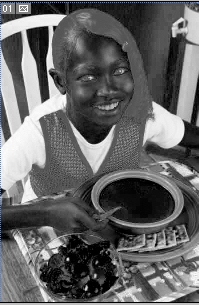
Blue Channel
- CMYK Mode:Pixels are recorded as a combination of Cyan, Magenta, Yellow and Black (K) color values
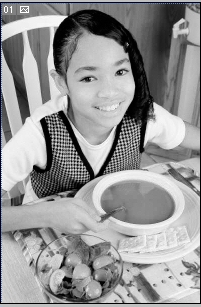
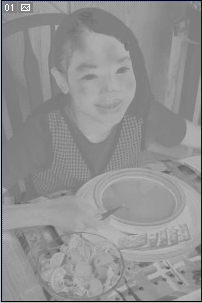
Cyan Channel
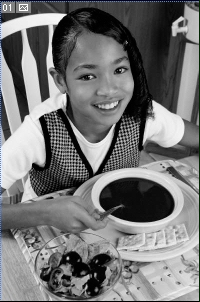
Magenta Channel
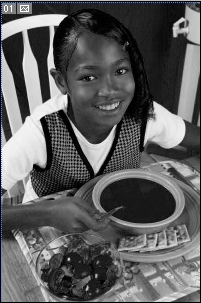
Yellow Channel
Black Channel
- Lab Mode:Pixels are recorded by their Lightness value and color values on a green-red axis (the 'a' axis) and the blue-yellow (the 'b' axis) scale
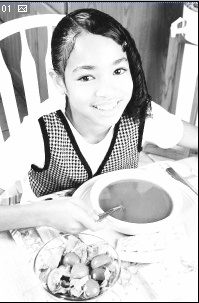
Lightness Channel
A Channel
B Channel
Applying Color Fills
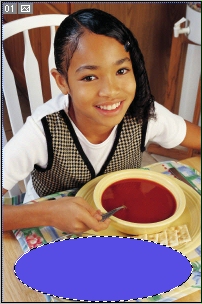
- Select the portion you want to apply the color with the selection
tools
- Choose a foreground color

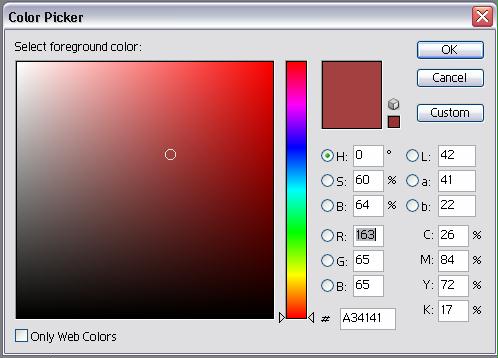
- Go to Edit > Fill
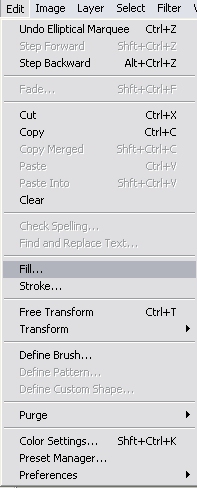
- The Fill Screen will open up
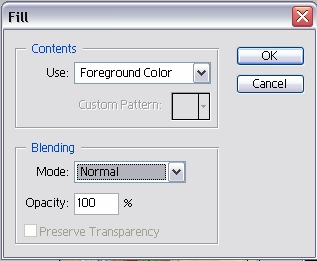
- Choose Foreground Color in the Contents > Use
- Choose an opacity percentage if you want a bit of transparency and
press OK
- Press Ctrl + D to Deselect the selected area
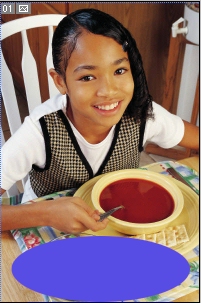
Opacity 100% Opacity 50%